
Events
Monitor Participation and Revenue with the Event Registration Report
Event teams need to constantly keep an eye on trends throughout the registration cycle: How many people have registered? Which organizations are attending? How are registrations trending compared to last week?
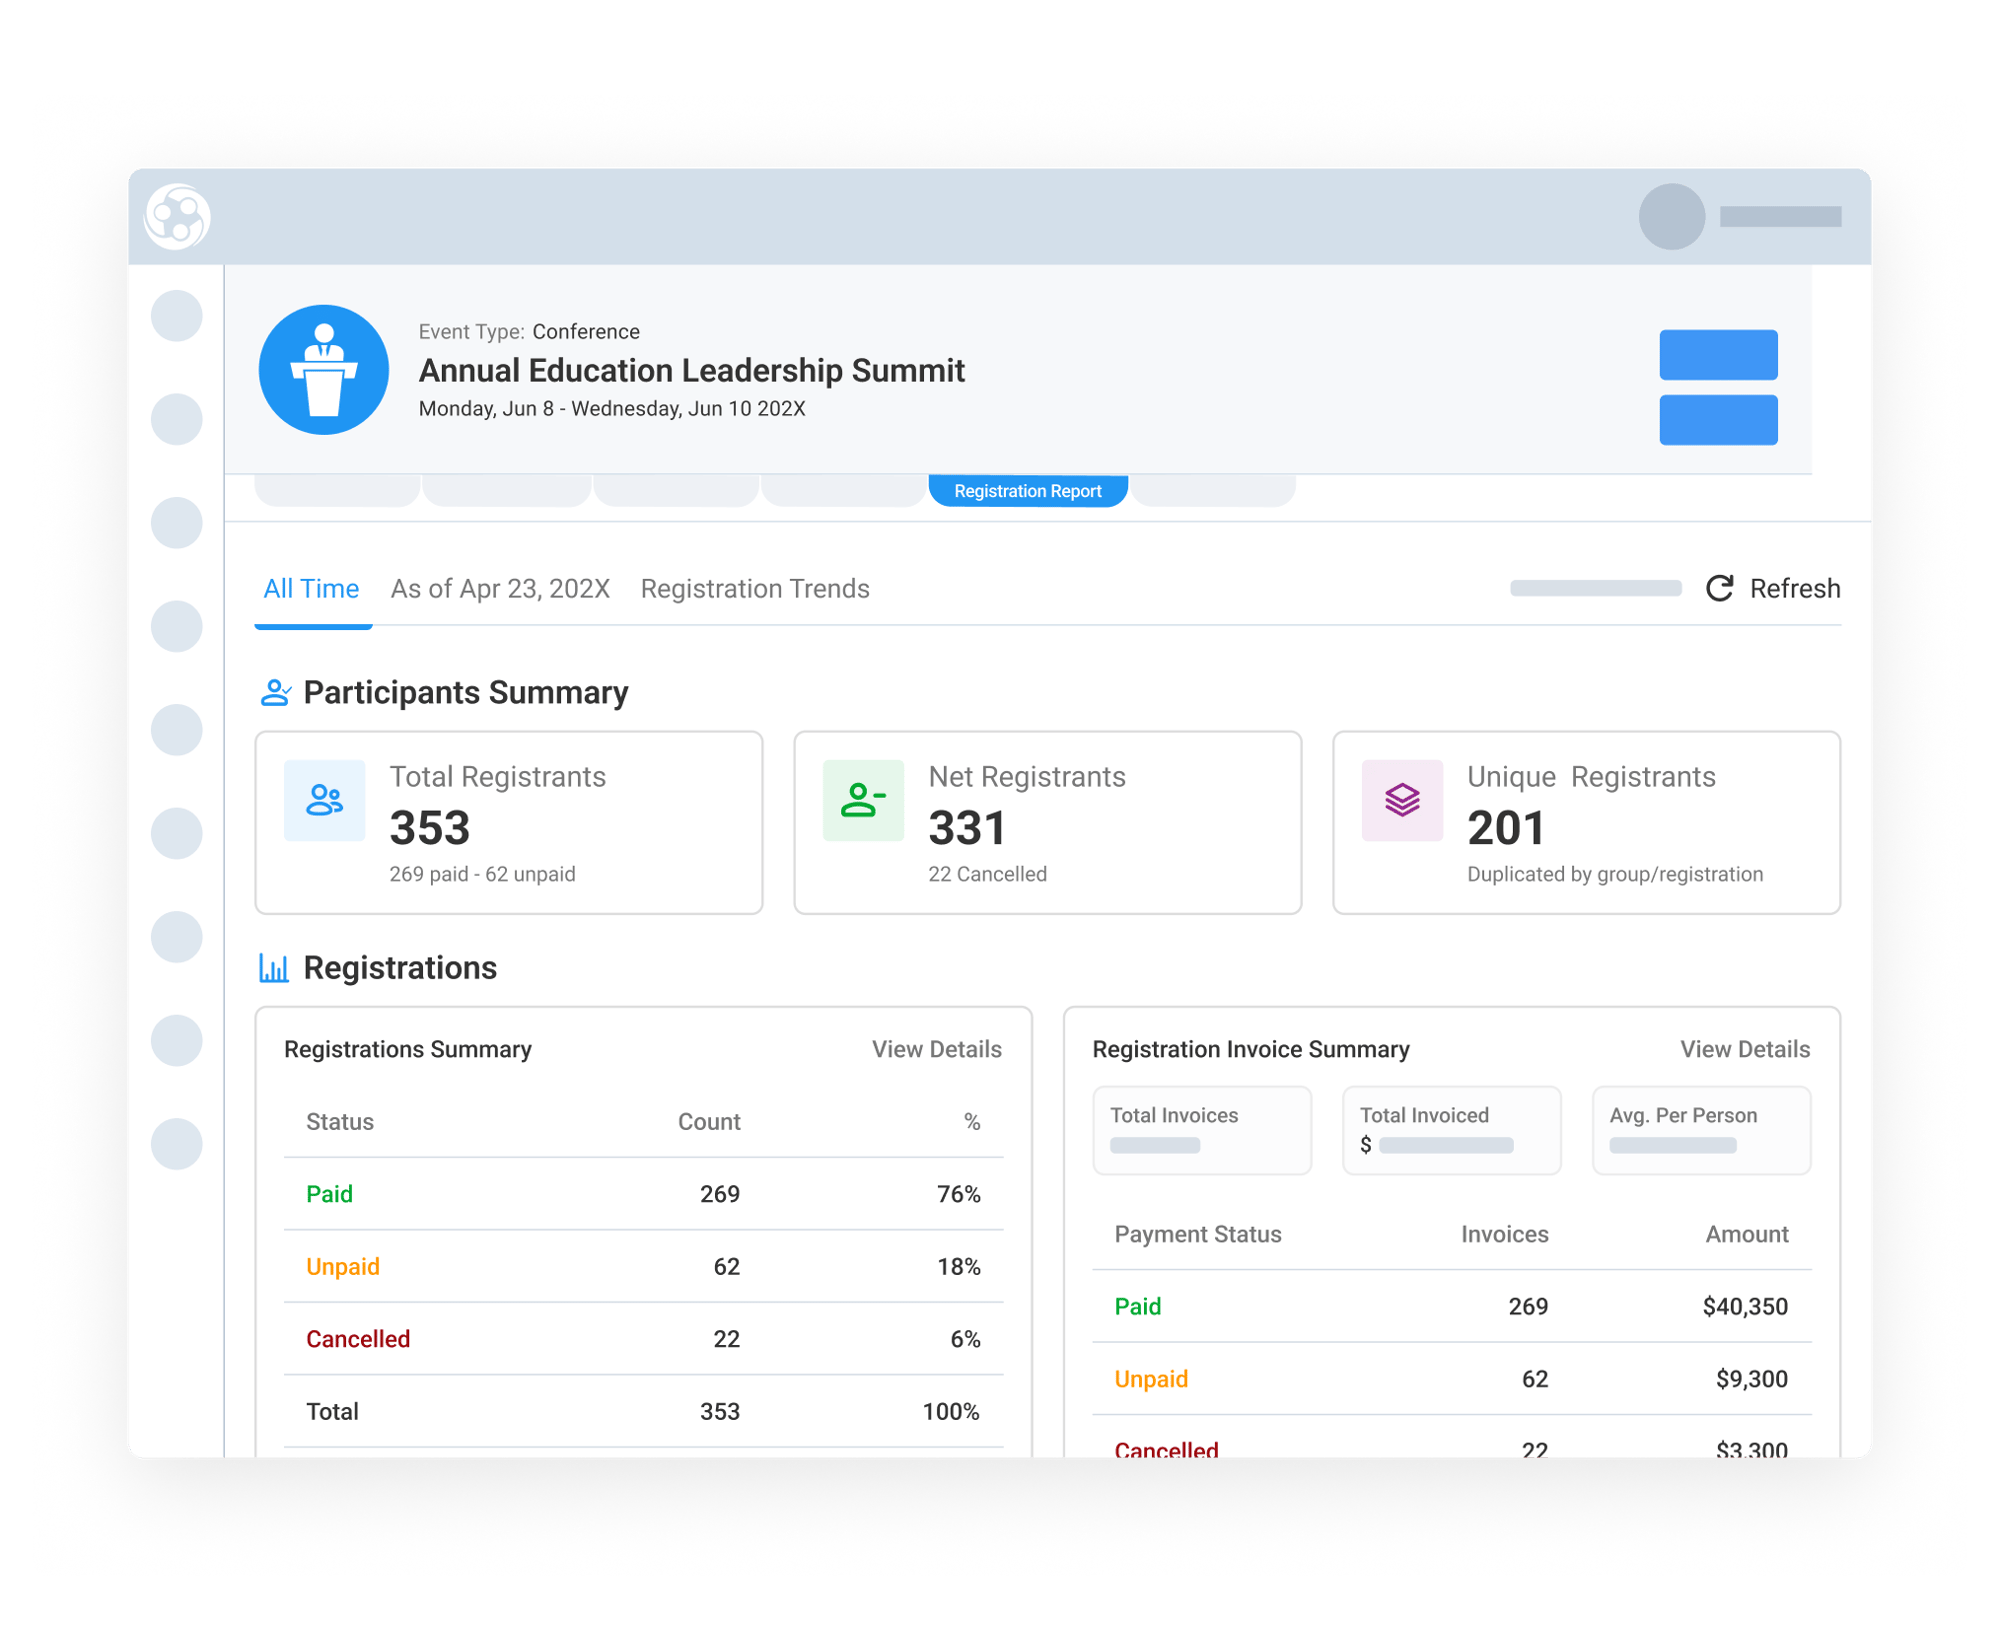
Most event platforms require spreadsheet exports and manual calculations to answer those questions. Engagifii’s Registration Activity Report brings registration, participation, revenue, and trend data together into one centralized reporting experience, helping associations monitor event performance in real time without exporting spreadsheets and building reports manually.
From organization participation tracking to historical comparisons and trend analysis, teams can quickly understand who is attending, what they purchased, and how registration activity is changing over time.
Reg Report
Monitor Registration and Revenue Activity in One View
The Registration Activity Report provides a unified snapshot of event participation and financial activity directly within the event. Teams can view:
-
Total registrants
-
Net registrations after cancellation
-
Invoice activity
-
Registration counts by type
-
Revenue totals tied to each registration category
The report also breaks down what participants actually registered for, including full registrations, companion registrations, meal tickets, press passes, and other bundled items.
Instead of simply knowing how many people registered, associations gain a clearer understanding of what attendees purchased and how those selections contribute to overall event revenue.
Track Organization Participation and Member Engagement More Clearly
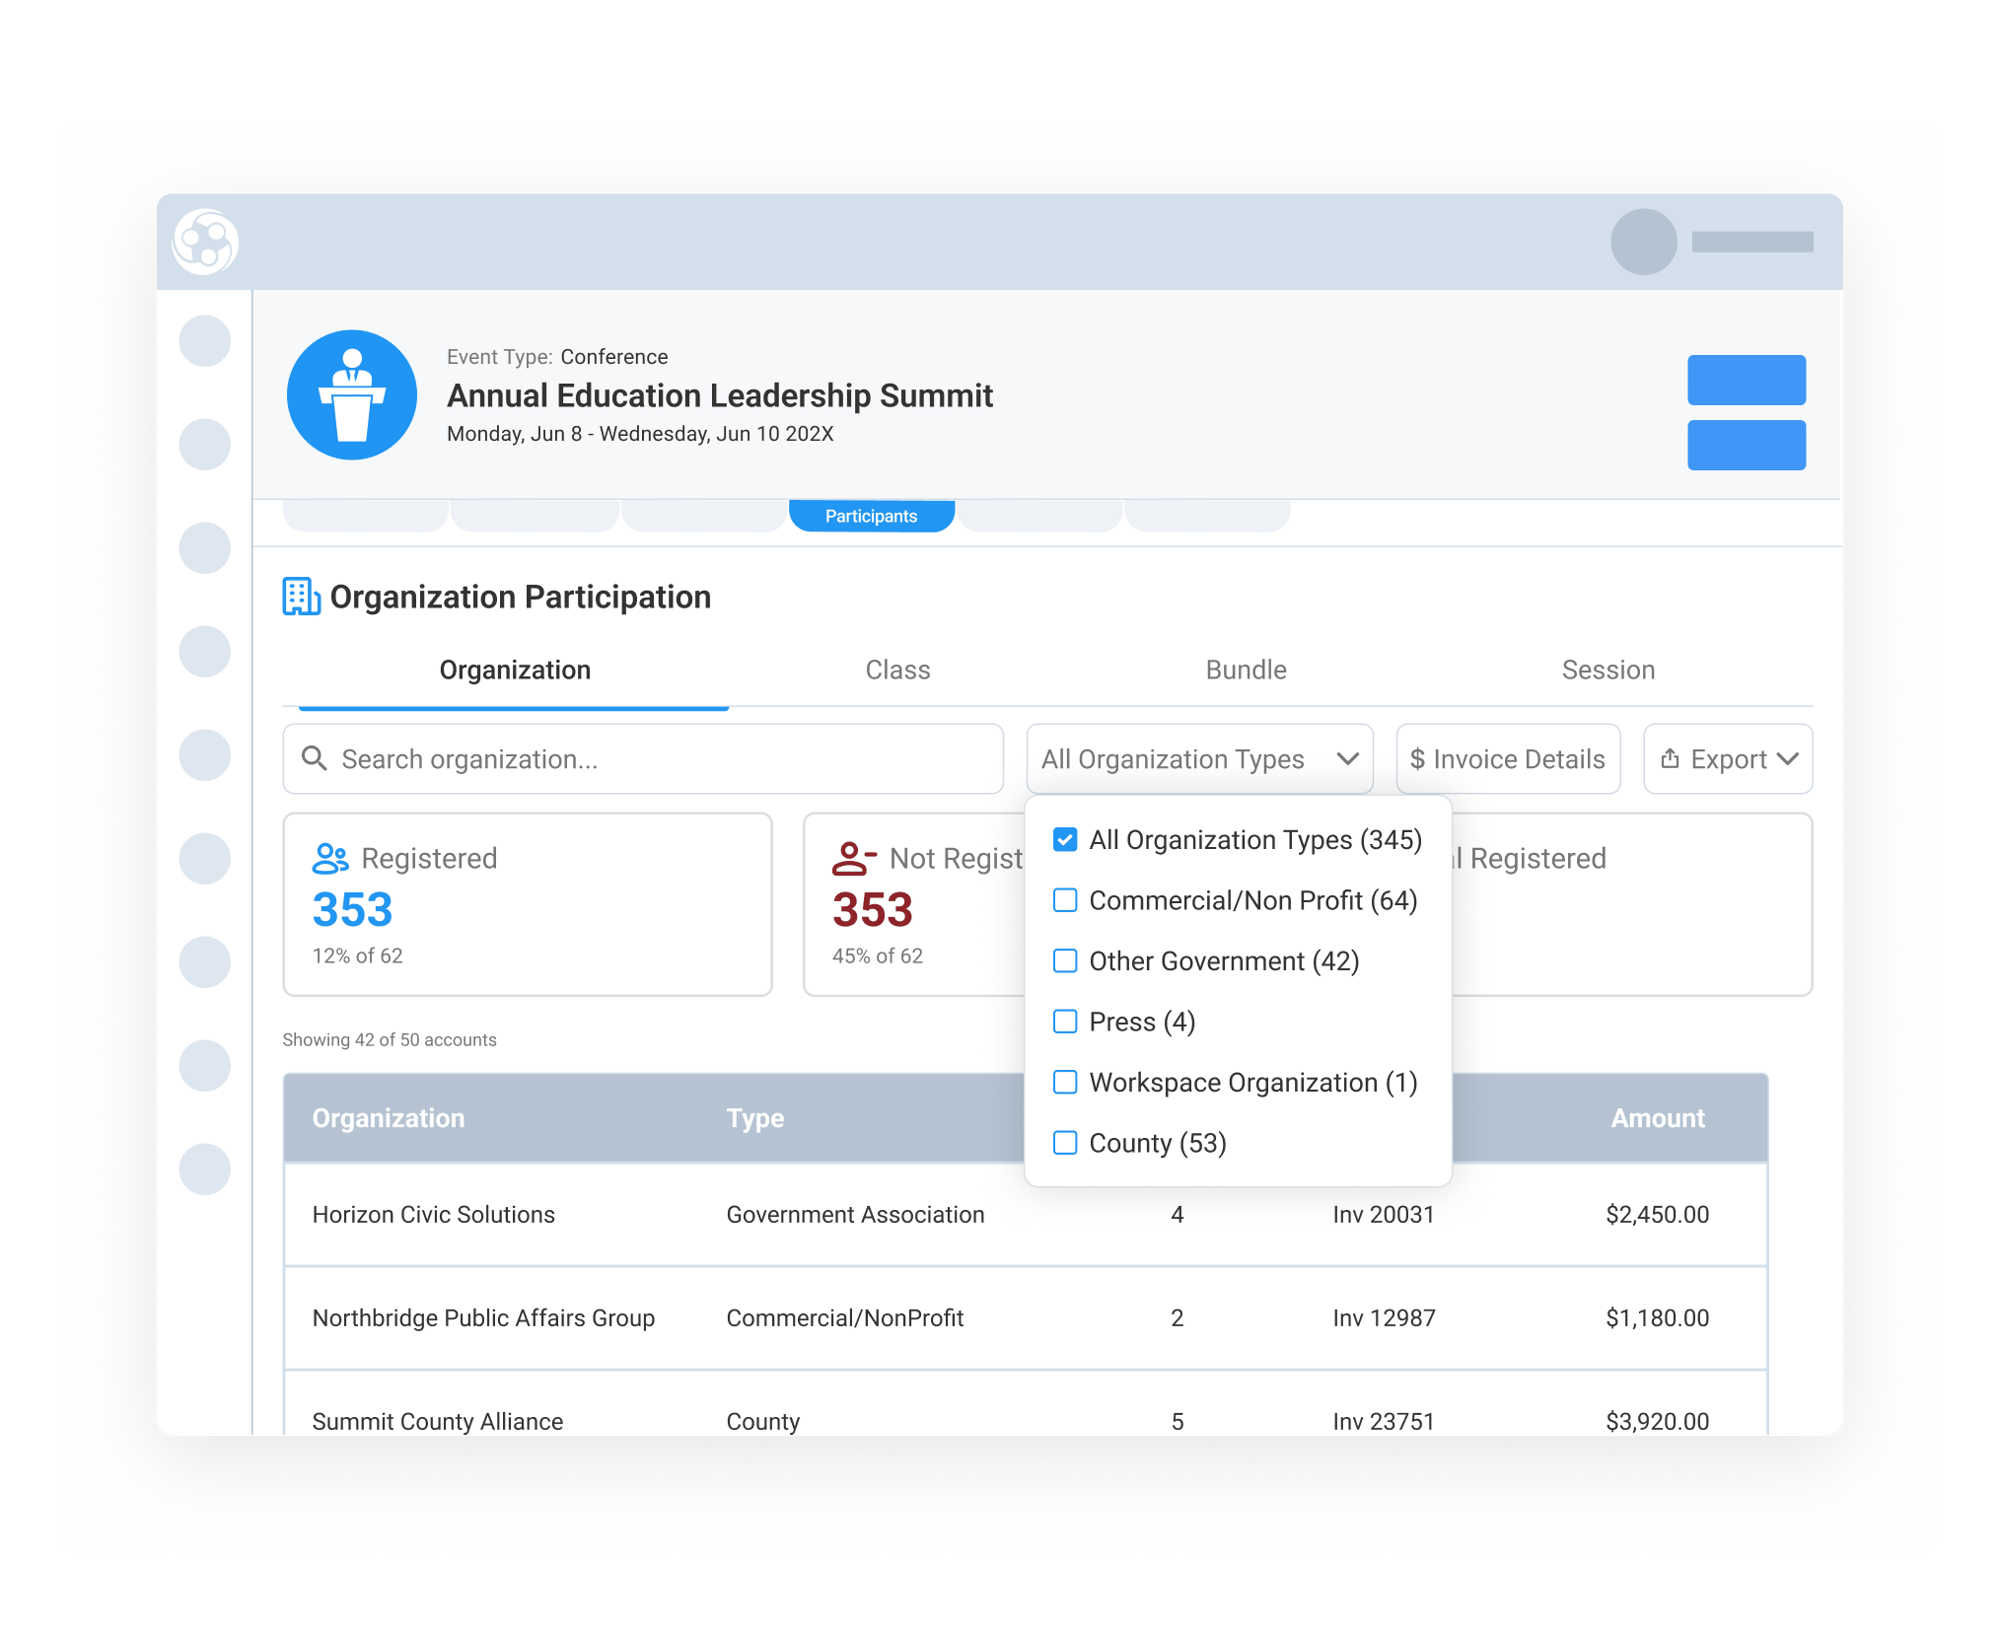
For many associations, one of the most important event questions is understanding which member organizations are actively participating. The Organization Participation view helps teams quickly identify:
-
Which organizations have registered
-
Which organizations have not registered
-
Participation by organization type
-
Registration breakdowns by organization
Teams can filter participation data by organization type, making it easier to analyze engagement across counties, districts, agencies, commercial/non-profits, or other member groups.
The Bundle View further improves insight when items are packaged together into bundles. Easily see everything purchased, including full registrations, companion tickets, meal selections, and other registration items. This helps associations better understand participation levels and member engagement across the event.
Rewind Registration Data to Any Point in Time
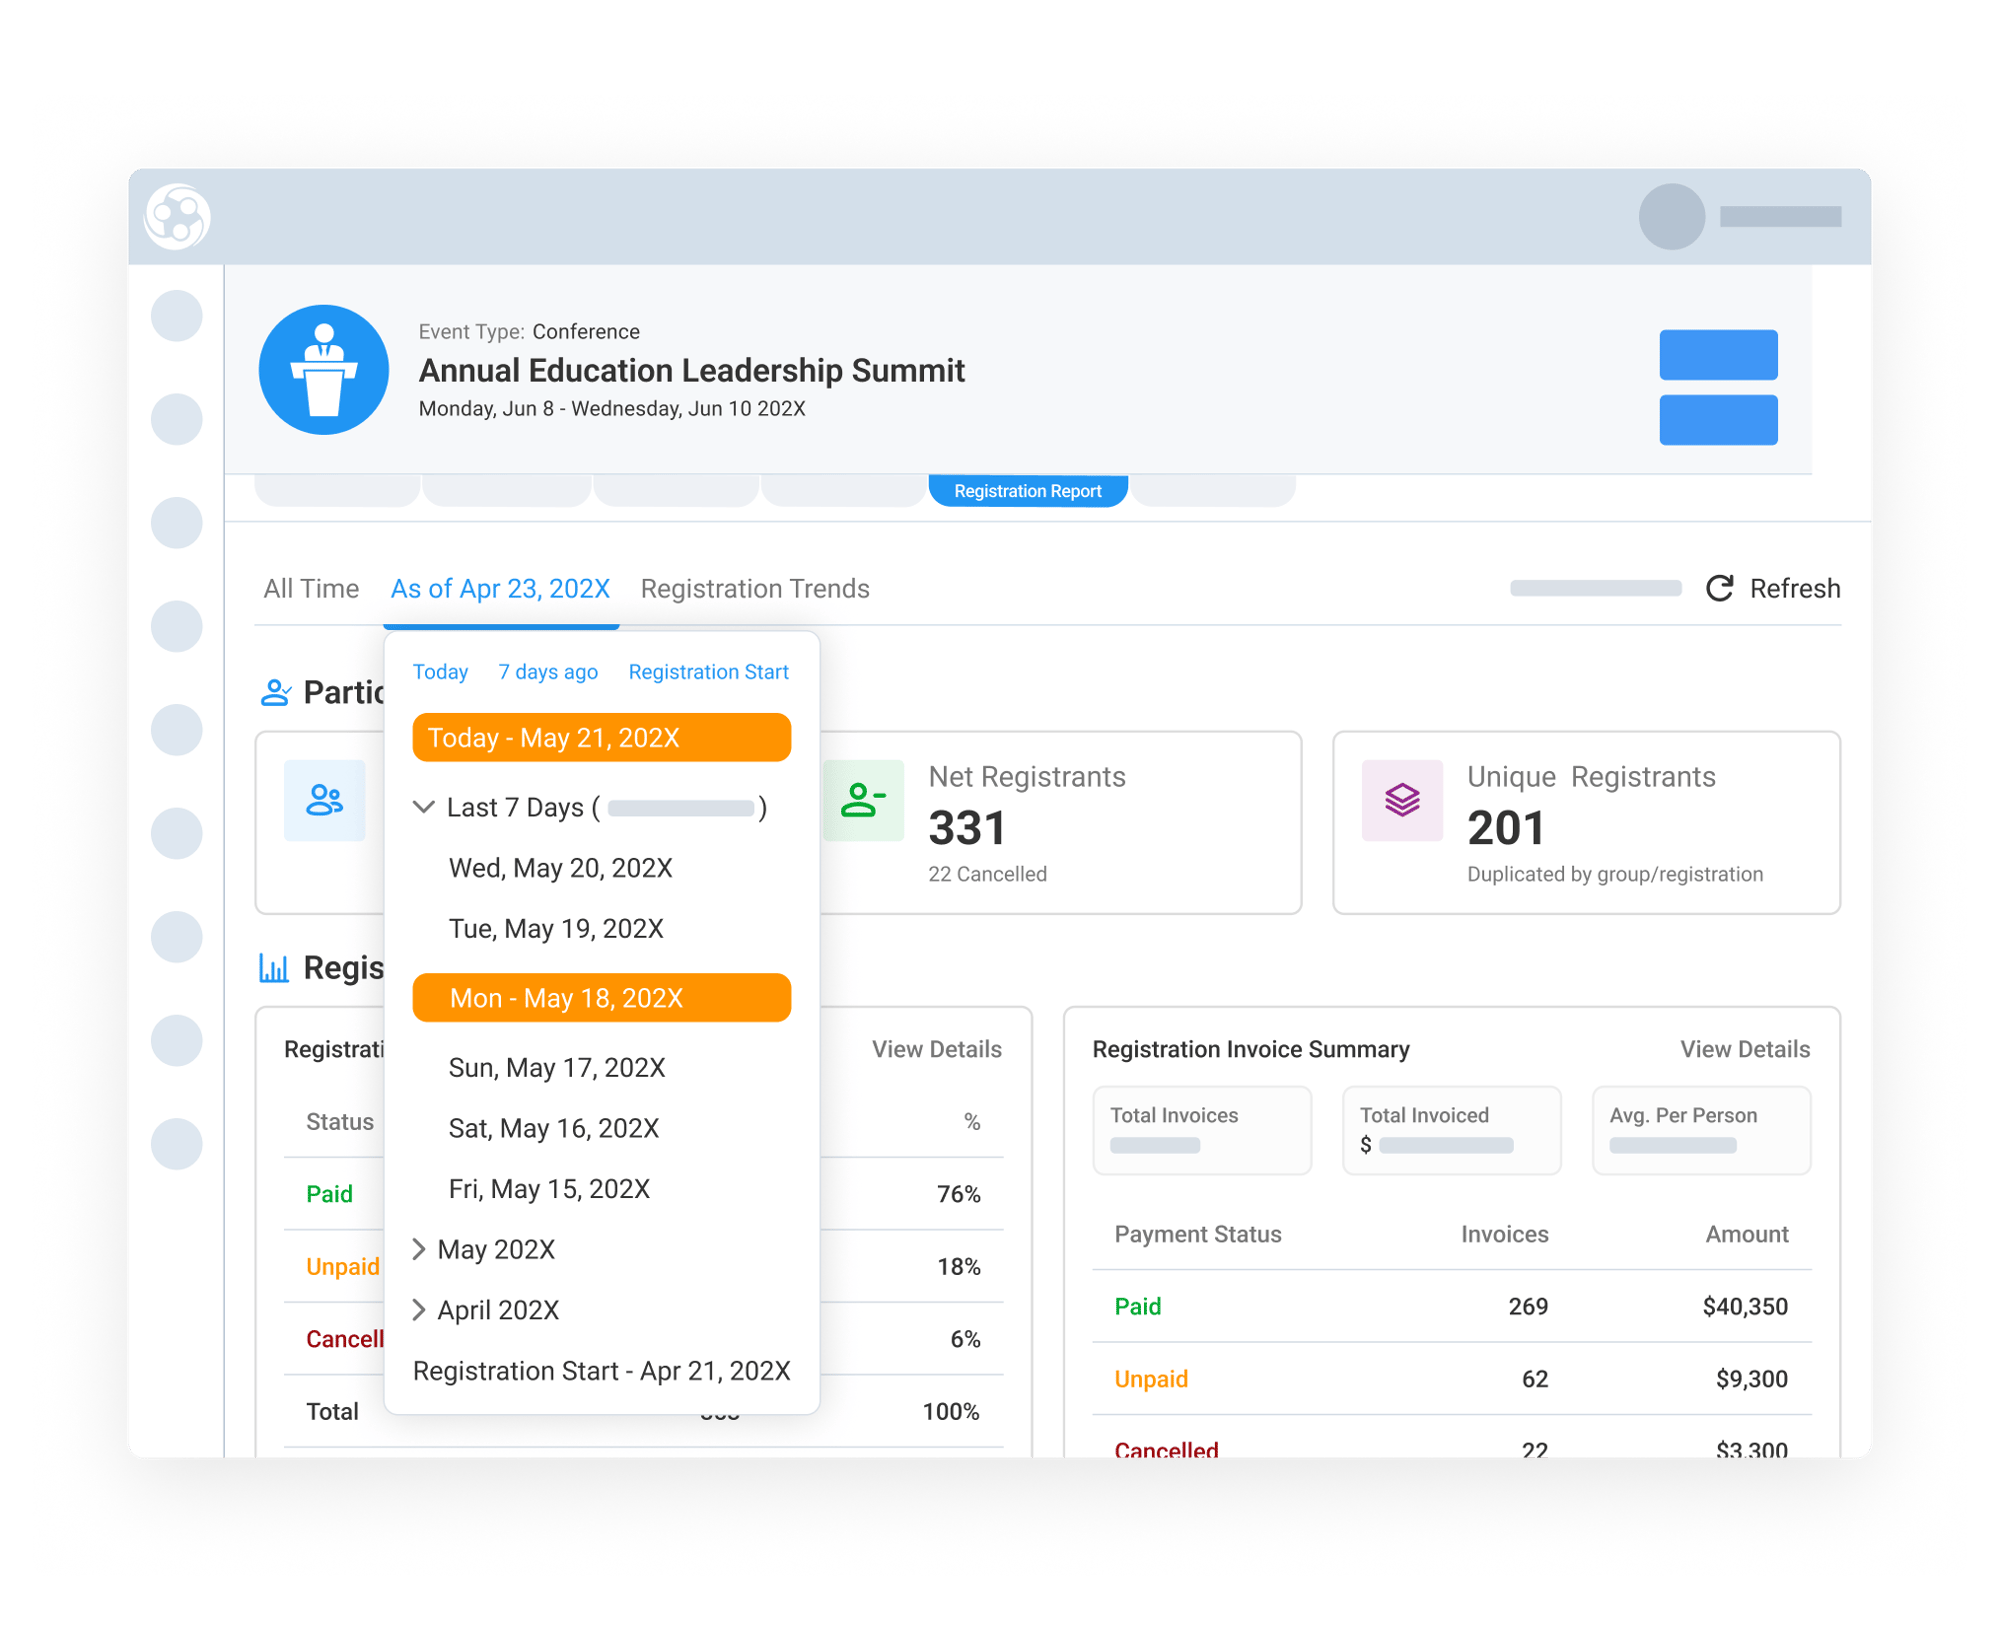
The Registration Activity Report includes an “As-Of” view that allows teams to rebuild the report based on a selected date during the registration cycle.
Instead of manually comparing spreadsheets from different weeks, staff can simply select a historical date and instantly view registration counts, participation levels, invoices, and revenue activity exactly as they appeared at that point in time.
This makes it easier to answer leadership questions such as:
-
How are registrations tracking compared to last week?
-
Did our efforts increase registrations?
-
When did registration activity spike?
-
How has invoice activity changed over time?
For organizations managing conference registration over several weeks or months, this creates a far more efficient and reliable reporting workflow.
Visualize Registration Trends and Export Reports Easily
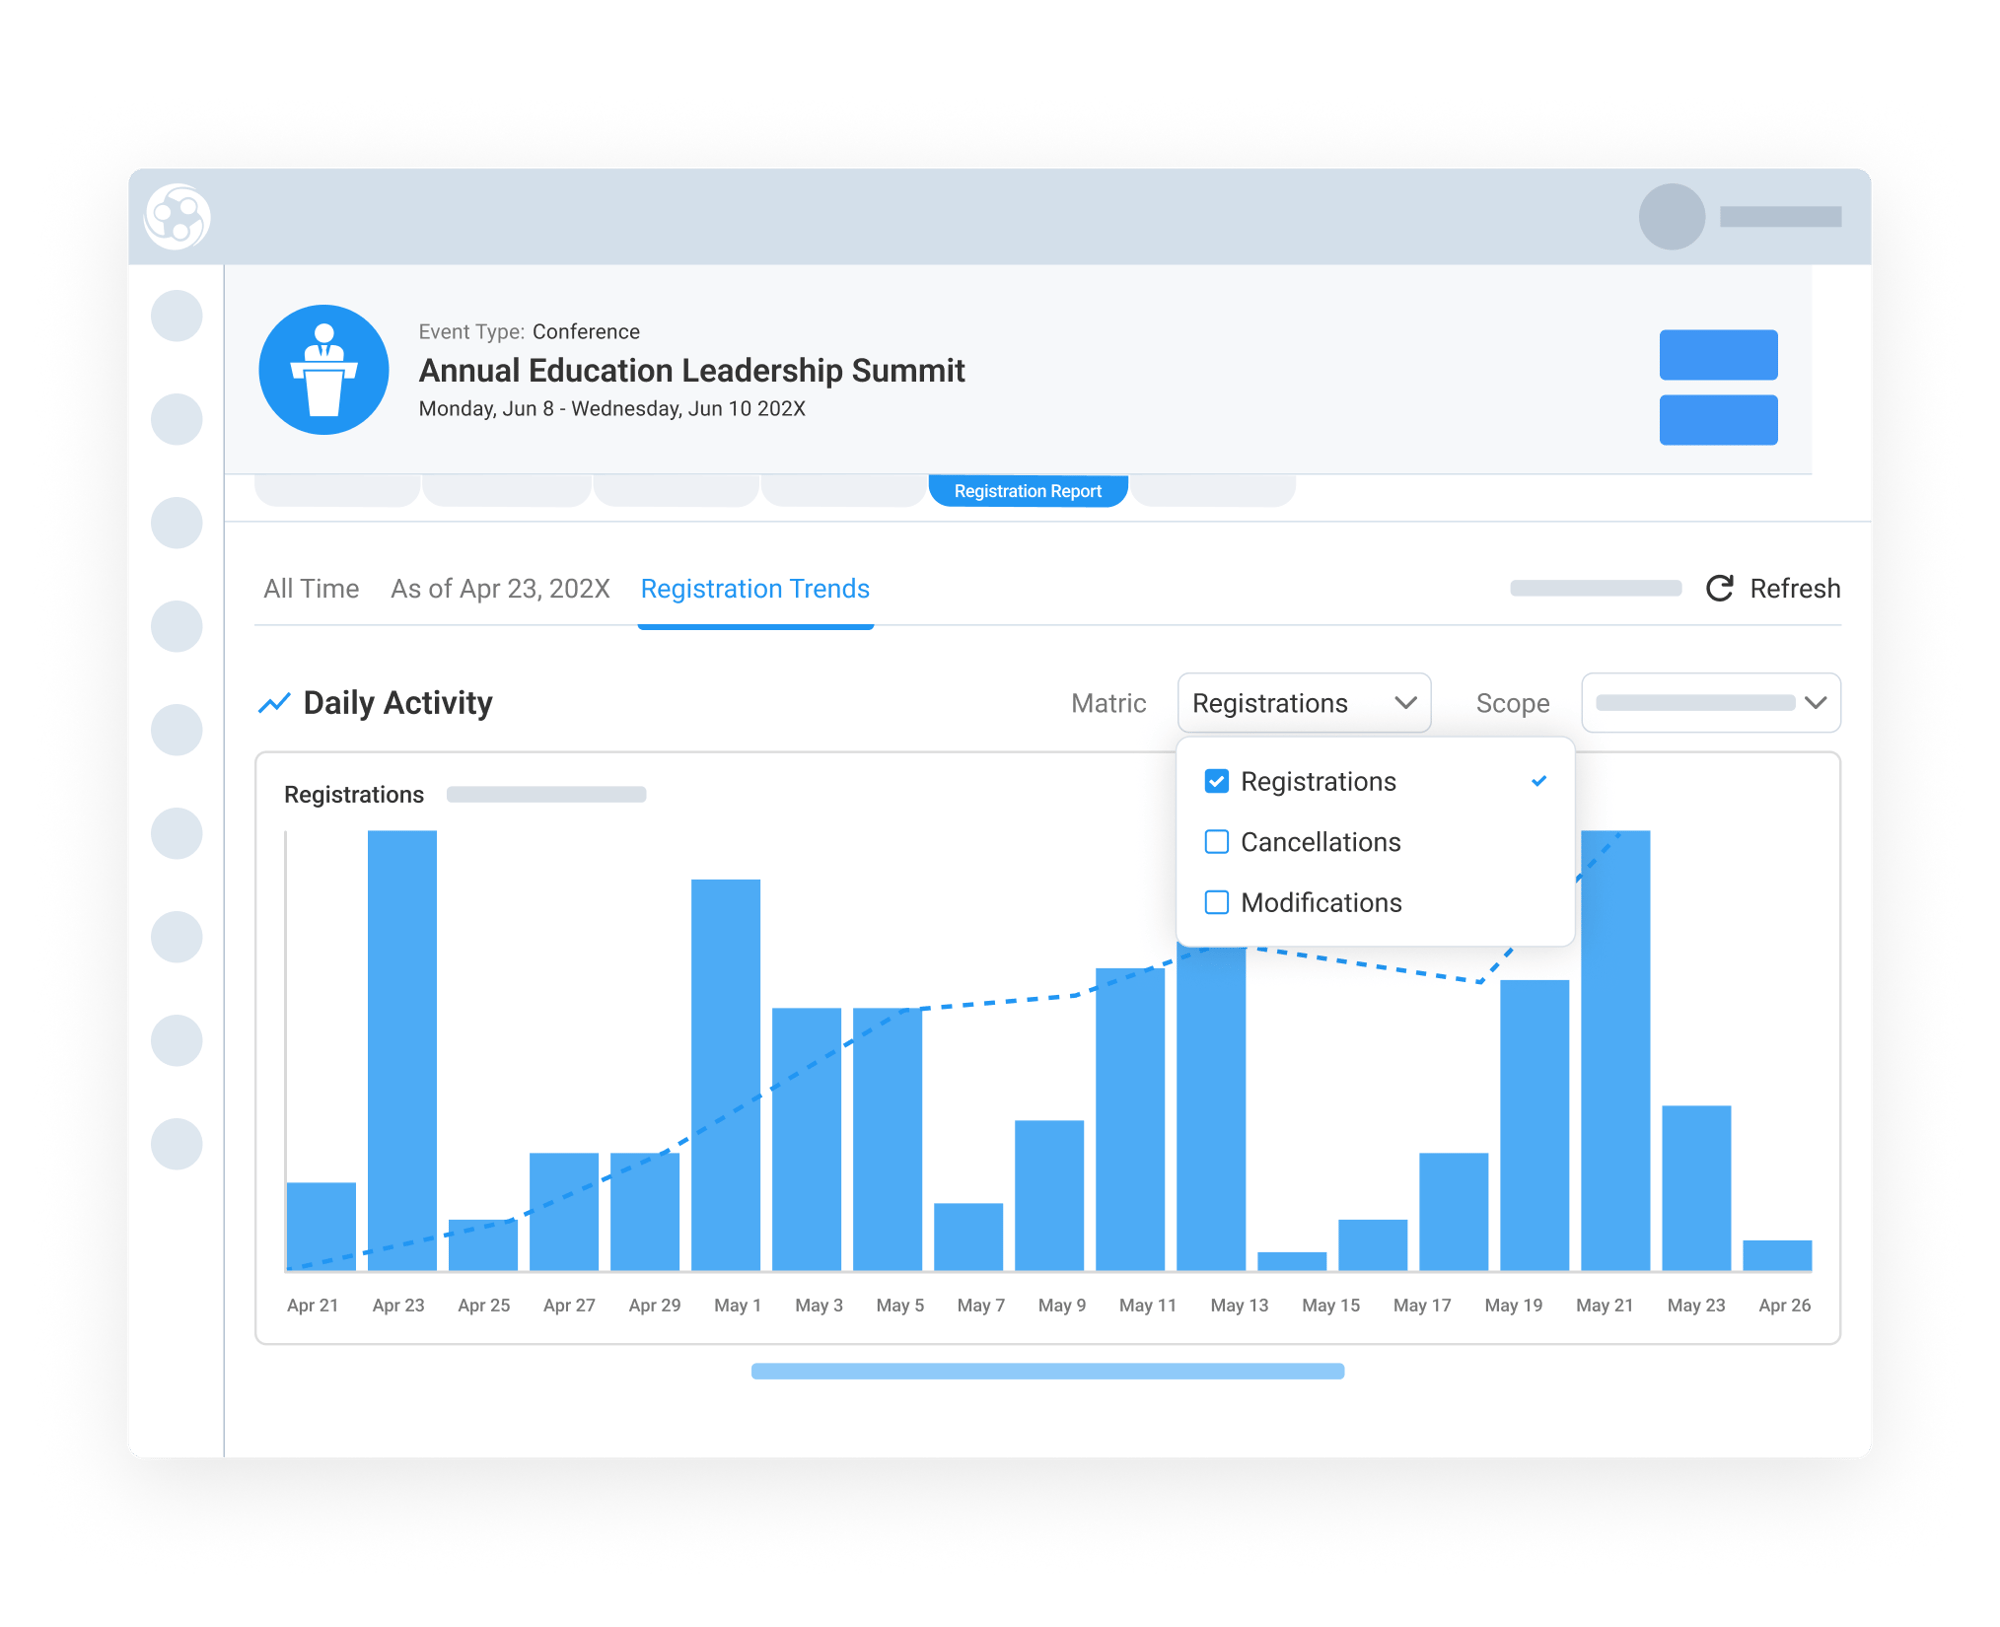
The Trends tab presents registration activity as intuitive charts and graphs, helping teams better understand event momentum over time. You can monitor:
-
Registration growth trends
-
Slow or high-activity periods
-
Impact of marketing campaigns
-
Invoice and payment activity alongside registration trends
All report views can also be exported cleanly into Excel or PDF formats, making it easier to share information with finance teams, executives, sponsors, or board members without rebuilding reports manually.
This allows teams to move from spreadsheet-driven reporting toward a more centralized and presentation-ready reporting process.